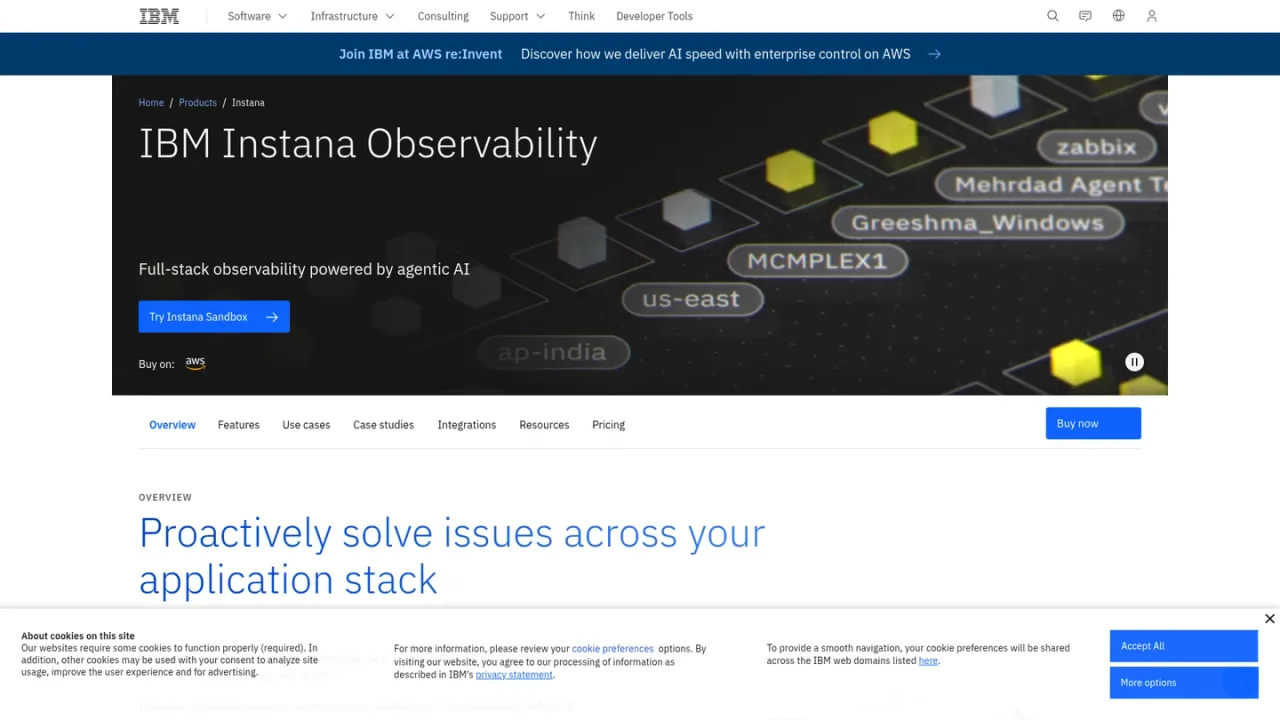
IBM Instana Observability is an AI-powered full-stack observability platform built for DevOps and engineering teams. It automatically discovers and instruments applications and infrastructure, delivering real-time visibility updated every second across more than 300 supported technologies. Agentic AI accelerates incident investigation by eliminating manual runbook creation and summarizing incidents, while automated resource optimization powered by IBM Turbonomic helps improve performance and reduce waste. Instana also maps GenAI workflows and agents, connecting prompts, outputs, tokens, latency, cost, and errors to full-stack context. Teams can monitor applications, infrastructure, Kubernetes, containers, databases, websites, and mobile apps, with OpenTelemetry Collector integration for cloud-native environments. Access options include PayPerUse, SaaS, and Self-Hosted plans, plus a 14-day free trial and a sandbox.
How to use IBM Instana
1
Start a trial or sandbox
Request the 14-day free trial or try the Instana Sandbox to explore the platform in your environment.
2
Deploy agents and collectors
Install Instana agents or integrate the OpenTelemetry Collector to automatically discover and instrument applications and infrastructure.
3
Review the dynamic map
Use the real-time infrastructure and service maps to understand dependencies and trace issues across the stack.
4
Investigate incidents with AI
Leverage agentic AI for root cause analysis, incident summarization, and faster remediation.
5
Optimize resources
Apply automated resource optimization recommendations to improve application performance and reduce waste.
IBM Instana Features
Automated discovery and instrumentation of applications and infrastructure
Real-time full-stack visibility updated every second across 300+ platforms
Agentic AI for incident investigation, root cause analysis, and summarization
AI agent and LLM observability for GenAI workflows
Automated resource optimization powered by IBM Turbonomic
OpenTelemetry Collector integration
Smart Alerts to reduce noise and prioritize critical events
Synthetic, mobile, website, cloud, container, Kubernetes, database, and infrastructure monitoring
IBM Instana Use Cases
Application performance monitoring
Infrastructure and cloud monitoring
Kubernetes and container monitoring
Incident investigation and remediation
AI/LLM observability
Digital experience monitoring
Resource optimization and cost control
IBM Instana FAQs
MVS stands for Managed Virtual Server (host), the unit used for Instana pricing calculations.
Essentials covers infrastructure monitoring, while Standard adds full-stack observability including APM, digital experience monitoring, and AI capabilities.
Yes, a 14-day free trial is available, and you can also try the Instana Sandbox.
IBM provides support through its support portal and community forums.
Pricing is based on MVS units and the chosen tier (Essentials or Standard), not separate charges for each monitoring type.
A license includes access to the observability platform with features varying by tier, such as automatic discovery, tracing, and AI capabilities.
Yes, Instana integrates with the OpenTelemetry Collector for custom metrics, events, and tracing.
The price you pay equals the number of MVS multiplied by your discounted price per MVS.